
Inverted Hammer
Introduction
Trading stocks might look like the most lucrative way of making money. No clients, no employees, no office, or anything. With a little capital and a smartphone with an internet connection and you are on the way to making millions!!
You are probably living under a rock if you think that is true. Making money as a trader requires a lot of patience and learning skills that take time to master.
One among the many skills is using candlestick patterns to identify trends and patterns in stock.
There are different candlestick patterns used by traders. One of them is Inverted Hammer.
Let’s dive deeper and understand this pattern in detail.
What is Inverted Hammer?
It is a single candle pattern that appears when a stock is in a downtrend. It is a powerful indicator of a trend reversal.
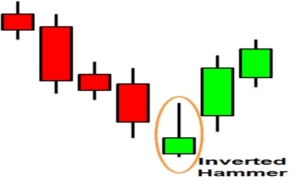
Because the candlestick looks like a hammer turned upside down, it is called “Inverted Hammer”.
This pattern forms after a downtrend and indicates a potential uptrend in a stock.
How to identify an Inverted Hammer?
The candle appears after a downtrend. The color of the candle can be either green or red.
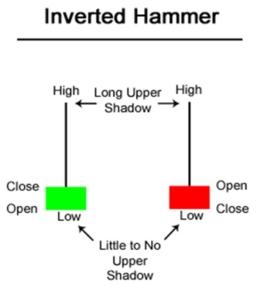
If the closing price is above the opening price, then the candle is green and if the closing price is below the opening price, then the candle turns red.
The candle has a small body and a long wick towards the upside. The lower wick is either very small or absent.
The price goes really high but falls back near the opening price.
Trading Strategy for Inverted Hammer
Simply identifying an inverted hammer pattern should not be taken as a buy signal. It is important to look at other factors such as time frame, volatility, etc.
An inverted hammer works best when combined with other technical analysis patterns.
A trader should first wait for the inverted hammer pattern to form on the chart.
This pattern is formed when there is a continuous fall on the previous days and the stock opens below, then rises high, and then closes slightly above the opening price.
If the candle on the next day is green and the price goes above the high of the “inverted hammer” candle, then it indicates an upside trend.
If the candle on the next day is red and the price falls below the “inverted hammer” pattern, it indicates that the trend has failed. Trades should be avoided in such cases.
Long-term investors can use this pattern to buy quality stocks at bargain prices.
Conclusion
The success of any candlestick pattern depends upon how familiar a trader is with them.
Even though these patterns are not always accurate, they are still an integral part of any trading strategy.
If an “inverted hammer” pattern appears on a chart, it does not always mean that there will be an uptrend.
Most traders end up in losses because they fail to validate these patterns along with other technical indicators.

Howdy!
If you’re here for the first time, let’s get introduced.
VRD Nation is India’s premier stock market training institute and we (Team VRD Nation) are passionate about teaching each and every aspect of investing and trading.
If you’re here for the first time, don’t forget to check out “Free Training” section where we have tons of free videos and articles to kick start your stock market journey.
Also, we got two awesome YouTube channels where you can continue the learning process.
Must-Read Articles


How to Recover from a Big Trading Loss?

Secret Weapons of Professional Traders

7 Habits of Highly Effective Traders

7 Reasons Why Traders Love Options

The Biggest Lie About Intraday Trading

Top 5 Books on Technical Analysis
Inverted Hammer
Introduction
Trading stocks might look like the most lucrative way of making money. No clients, no employees, no office, or anything. With a little capital and a smartphone with an internet connection and you are on the way to making millions!!
You are probably living under a rock if you think that is true. Making money as a trader requires a lot of patience and learning skills that take time to master.
One among the many skills is using candlestick patterns to identify trends and patterns in stock.
There are different candlestick patterns used by traders. One of them is Inverted Hammer.
Let’s dive deeper and understand this pattern in detail.
What is Inverted Hammer?
It is a single candle pattern that appears when a stock is in a downtrend. It is a powerful indicator of a trend reversal.
Because the candlestick looks like a hammer turned upside down, it is called “Inverted Hammer”.
This pattern forms after a downtrend and indicates a potential uptrend in a stock.
How to identify an Inverted Hammer?
The candle appears after a downtrend. The color of the candle can be either green or red.
If the closing price is above the opening price, then the candle is green and if the closing price is below the opening price, then the candle turns red.
The candle has a small body and a long wick towards the upside. The lower wick is either very small or absent.
The price goes really high but falls back near the opening price.
Trading Strategy for Inverted Hammer
Simply identifying an inverted hammer pattern should not be taken as a buy signal. It is important to look at other factors such as time frame, volatility, etc.
An inverted hammer works best when combined with other technical analysis patterns.
A trader should first wait for the inverted hammer pattern to form on the chart.
This pattern is formed when there is a continuous fall on the previous days and the stock opens below, then rises high, and then closes slightly above the opening price.
If the candle on the next day is green and the price goes above the high of the “inverted hammer” candle, then it indicates an upside trend.
If the candle on the next day is red and the price falls below the “inverted hammer” pattern, it indicates that the trend has failed. Trades should be avoided in such cases.
Long-term investors can use this pattern to buy quality stocks at bargain prices.
Conclusion
The success of any candlestick pattern depends upon how familiar a trader is with them.
Even though these patterns are not always accurate, they are still an integral part of any trading strategy.
If an “inverted hammer” pattern appears on a chart, it does not always mean that there will be an uptrend.
Most traders end up in losses because they fail to validate these patterns along with other technical indicators.


Leave A Comment