
What is Equity Curve Trading ? [Best Money Management Tool in Trading]
Have you tried trading strategies that sometimes work and sometimes don’t?
It can be frustrating, especially for beginners because they see a strategy work very well for a few months and then stopped giving consistent results.
What we have to realize is that all trading strategies are dependent on market context. For example, strategies that work in expanding markets do not work very well in contracting markets. Or strategies that work well in bull markets do not do well in bear markets.
So, wouldn’t it be nice to know when the market context is changing, so that we can turn ON and OFF the strategies in time?
Equity curve trading is one such method.
What is Equity curve?
For learning that, let’s use a little example.
There’s a trader named Jack. He learns about a great positional trading strategy.
The strategy works very well. In fact, with a starting capital of Rs.1 Lakh, he makes a net profit of 1,000 rupees per month and hence he is very happy.
Let’s draw an equity curve for this strategy.
For doing that, we will first have to add a column called “Cumulative Profit/Loss”. It is the total profit or loss Jack had made by that month.
So, in Jan, he made a total profit of Rs.1000. In Feb he made another 1000, so his cumulative profit would be 1,000+1,000 = 2,000. Similarly, in March the cumulative profit would be 1000+1000+1000 = Rs.3000.
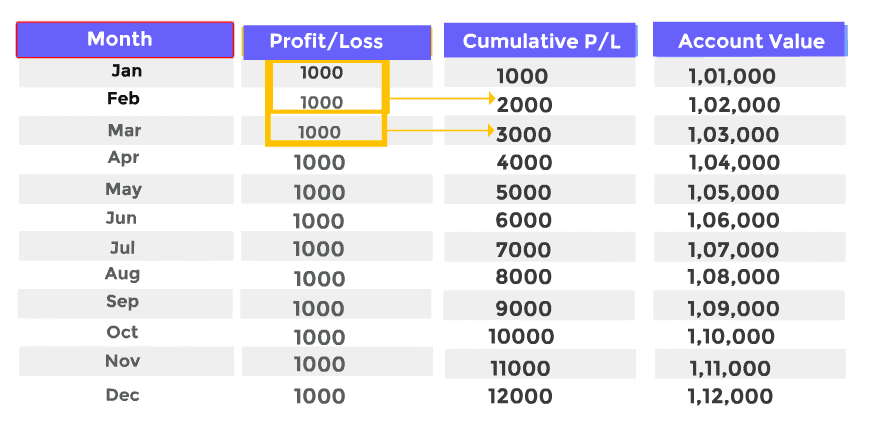
You get the idea.
The next column we will add is “Account Value”. So Jack started with Rs.1 Lakh and by the end of January, his account value would be 1 lakh, 1 thousand rupees.
By February, his account value had gone up to Rs.1,02,000 and so on.
Now, traditionally the equity curves are plotted based on Account value. So on the X-axis, will be time and on the Y-axis is the Account value. We will also add a trend line to get a better sense of how the strategy is performing.
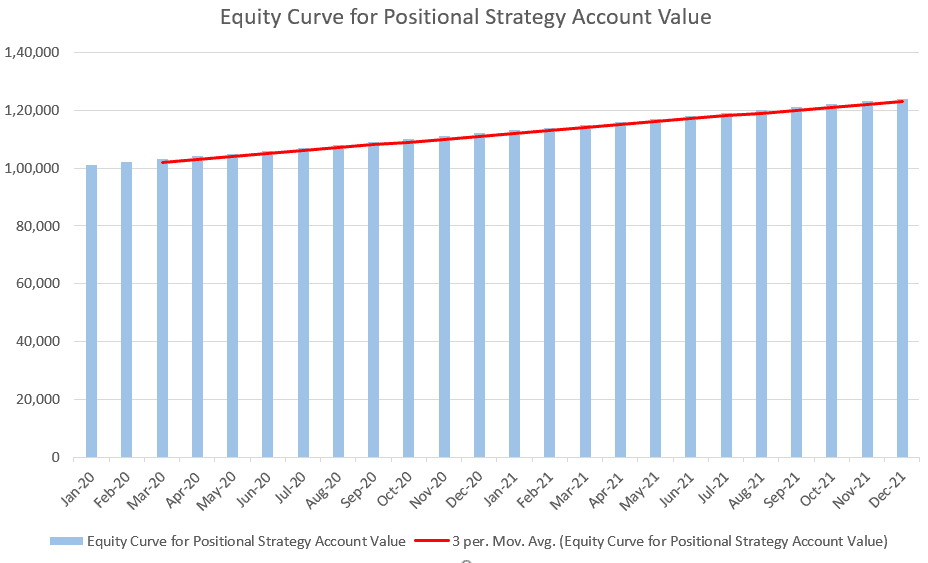
What you see right here is called an Equity curve. It shows you how your account value is changing over a while.
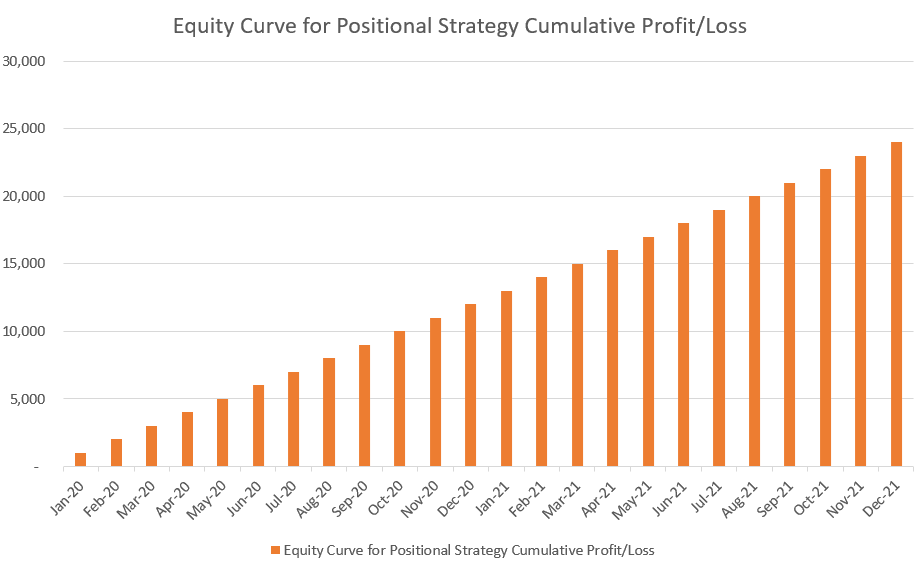
Although it is conventional to use account value for plotting an equity curve, I find it more useful to plot the Equity curve based on cumulative profits/losses. It gives you a better visual of how you are doing.
You can plot it whichever way you want- it doesn’t matter.
Here is the EC based on the same data. It shows the net profits you made by a certain date.
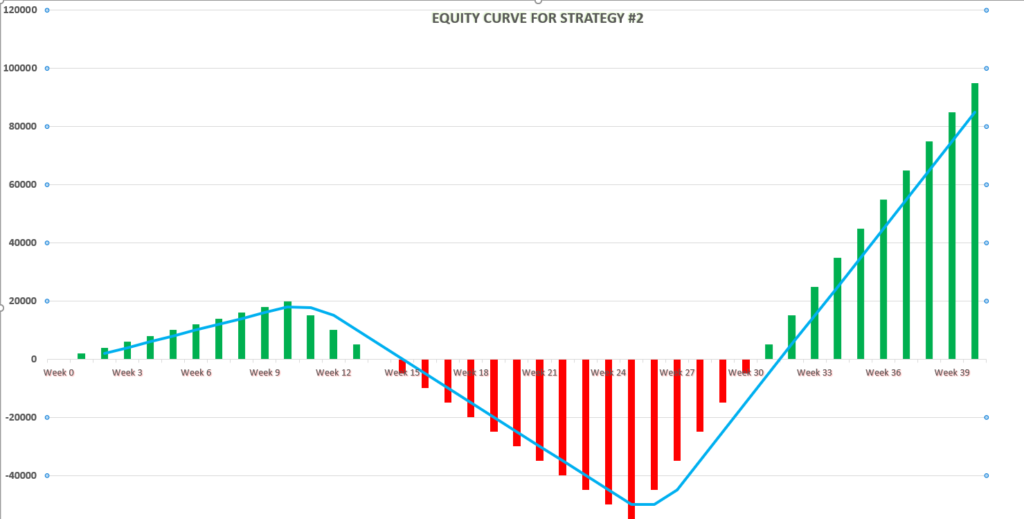
With his initial success, Jack is getting excited about the stock market and gets into swing trading. Let’s see how his swing trading strategy is performing.
In the beginning, it didn’t do so well. He consistently lost 1000 rupees for the first 6 months. But, he kept refining the strategy, and by July, his efforts paid off. He started making Rs.2000 per month.
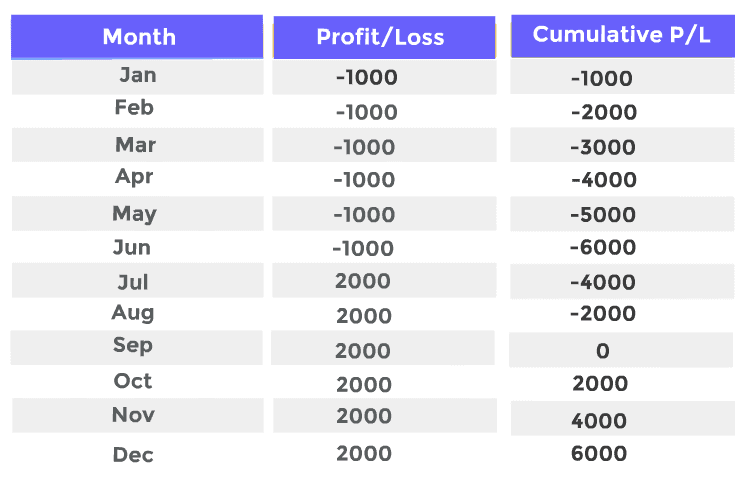
To plot the EC for this strategy, let’s do the same thing that we did for Strategy #1. Add a “Cumulative P/L” column. Calculate the values. Here, his cumulative loss in Feb would be Rs.2000. By June he had already lost Rs.6000. After that, the cumulative losses begin to drop down and by October, he is back in profit.
This is how the Equity curve would look like:
I hope the concept of the Equity curve is absolutely clear in your mind.
Equity Curve Trading
EC trading is essentially using Equity Curve as an indicator to turn ON and OFF trading strategy and it is as simple as that. When a strategy is working fine, you keep riding the wave but when it stops working, you turn it off, meaning, stop putting money into it.
Here is something very important: stop putting money into the strategy doesn’t mean you abandon the strategy. On the contrary, you need to start refining it.
Let’s go back to the same example and see what it means
To find out the inflection points where the strategies start and stop working, traders use a simple moving average. So, if the equity curve falls below, let’s say 20 days moving average, they will put the strategy on hold. They then continue to paper trade the strategy until it gets above the moving average and then trade it live again.
Notice this: This peak to trough decline is also called “Draw downs”.

Back testing
One of the biggest benefits of equity curve trading is back testing. You take your strategy, which can be a combination of certain technical indicators and run them through the past 4-5 years of data. It can be an intraday, swing or positional strategy- doesn’t matter.
By applying the equity curve trading technique, now find out whether turning on and off that strategy would have made sense at the inflection points.
I use an Equity trading strategy with a 200-day moving average and it works almost 80-90% of the time.
Ok, I hope you understood how Equity Curve Trading works.
5 Tips for Using Equity Curve Trading
#1
There should only be one equity curve per strategy. Beginners, sometimes, even experienced traders try to plot several strategies in one equity curve. The problem with doing that is what you see in the equity curve is a mixture of several strategies and you can’t understand which strategy is working and which one is not.
Number #2
Keep refining the strategy after they crossover below the moving average. Remember, as I said earlier, do not abandon the strategy at this inflection point. Use this time to fine-tune your technical parameters.
My students and I extensively this tool called “Amibroker” for refining our strategies.
Number #3
Optimize the Moving average. Now, one size doesn’t fit all when it comes to the MA. Back testing can show you which moving averages work the best for which kind of strategies. So, play around with them and see what works the best.
Number #4

Don’t forget that some strategies are seasonal. A strategy that works well in the bull market may not work very well in the bear market. Similarly, a strategy working well in expanding markets may not do well in the contracting market. I have even seen some strategies that stop working close to election year.
What all that means is to try spotting these correlations with the different market factors. I have a list of over 10 parameters that I ask my students to run their strategies against and see any corrections.
Number #5
At a very high level, check if there is a problem with strategy or execution. If most of your strategies are bumpy- meaning that every couple of months they dip below the moving average, then there might be a bigger issue here.
If that is happening, I suggest you analyse whether you’re executing the strategies properly or not. Sometimes you may have a great strategy but just because of your lack of patience or risk management, you take a loss and come out. In that case, it will not be smart to blame the strategy and you have to work on your trading psychology.
Alright, guys, I hope you understood what Equity curve trading is and how it can be used to our advantage. Using this technique, go elevate your trading game!

![What is Virtual Contract Note [Zerodha]](https://www.vrdnation.com/wp-content/uploads/2023/10/maxresdefault-virtual-note-500x383.jpg)


Leave A Comment